


Announcing 2019 Good Food 100 Restaurants™
Dear Industry Change Makers and Eaters,
I’m thrilled to announce the third-annual list of Good Food 100 Restaurants™! In total, we had 137 participants, operating 341 locations, in 29 states, and all eight regions of the United States, as defined by the Bureau of Economic Analysis, represented.
In an age where more and more diners are craving transparency, the Good Food 100 Restaurants list, which verifies restaurants’ “good food” purchases, offers consumers an easy way to vet restaurants and food service companies before spending their dining dollars. As an extension of taking the survey, the participants gain unprecedented insight into their businesses. “We all talk about farm-to-table and transparency and buying local, but this process allows you to see if you really are walking the talk,” says Paul Reilly, chef and co-owner of Beast & Bottle and Coperta in Denver, Colorado.
List Analysis
Of the 137 survey participants, fine-dining restaurants made up 66 percent of the entrants, with casual eateries coming in at 14 percent, and fast-casual spots rounding out at 10 percent. Food service, specialty grocer/lunch counter, and catering services made up the remaining six percent.
Participating restaurants reported operating an average of 10.6 years, with 36 percent five years old or less. More than 53 percent of participating businesses reported being owned or co-owned by a female or minority, and 38 percent reported having a female executive chef, culinary director, CEO, or owner.
The percentage of good food purchases was greatest for participating Specialty Grocer/Lunch Counter and Other (Catering, Quick Service, and Meal Delivery Service) restaurants with 95 percent each, followed by Fine Dining restaurants (88 percent), and Fast Casual (86 percent). Nationally, restaurants reported the greatest percentage of good food purchases in the Fish and Seafood (85 percent) and the Meat and Poultry (83 percent) segments.
Of the participating restaurants and food service operators, 103 achieved six links, which is the maximum rating (links are akin to stars in a typical rating system). The ratings correlate to the percentage of total food costs spent to support state, regional, and national “good food” producers and purveyors. The links correspond to the critical points of the food chain: environment, plants and animals, farmers, ranchers, fishermen, restaurants, and eaters. Twenty-two businesses received five links, five earned four links, five nabbed three links, and one was awarded two links. (One restaurant, Saint Stephen was not yet operating at the time of the survey but provided qualitative responses to the survey). While most restaurants exceeded the minimum threshold for good food purchases, restaurant purchases in this study needed to meet at least the minimum thresholds to be considered good food purchases (see FAQ for more information).
Methodology
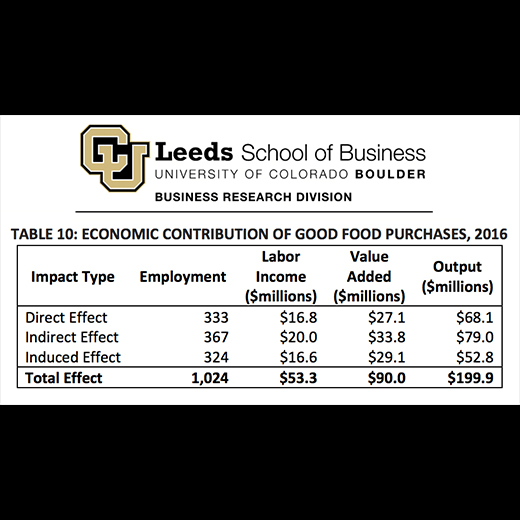
All U.S. restaurants and food service operations—quick service, fast casual, casual dining, fine dining, meal delivery, catering, and food service—were eligible to take part in the survey. The list is based on annual, self-reported food purchasing data, independently verified by NSF (NSF.org), and then analyzed by the Business Research Division at Leeds School of Business at the University of Colorado Boulder.
Impact
The 137 participating restaurants spent a total of $100.7 million on food, of which $69.9 million were spent on good food ($66.3 million of that was spent domestically). Those purchases resulted in a $213.5 million impact on the national good food economy, including direct, indirect, and induced impact of the purchases. Economic benefits refer to dollars generated and distributed throughout the economy due to the existence of an establishment. This excludes the impact of overall business operations, ranging from the purchase of alcohol to labor and rent.
Business Practices
This year’s survey also included questions regarding participants’ business practices, including hourly wages paid to both non-tipped and tipped employees, access to healthcare (78 percent reported providing healthcare to employees), as well the percentage of employees who are female (50 percent) and people of color (31 percent). Restaurants in the Casual Dining, Food Service, and Other categories employed more part-time workers than the average. Food Service, Specialty Grocer/Lunch Counter, and Other restaurants had more female employees than average, and Casual Dining, Food Service, and Fast Casual restaurants employed more people of color than average.
The survey’s most subjective question asked participants how important Good Food is to their brand. Not surprisingly, all restaurants across all segments rated Good Food 9.1 or above (on a 10-point scale), while individual restaurants (regardless of type) rated Good Food’s brand importance between 5 and 10, with an average of 9.6. Participants similarly ranked the brand importance of an ethical, sustainably-minded supply chain.
Call To Action
I have said it before, and I’ll say it again: Restaurants are powerful catalysts for change. When chefs and restaurants purchase good food, they have the power to impact not just what’s on a diner’s plate, but every link in our food supply chain—from the environment and animals to farmers and their staff and guests—as well as state, regional, and national economies. Change happens in the kitchen, but ultimately eaters must create the demand by voting with their forks and dollars.
Cheers,
Sara Brito
Co-Founder/President, Good Food Media Network, a 501(c)(3) nonprofit